

Content with tag respect .
- Trends in natural forest cover
-
The following information shows the status and trends for a number of indicators related to natural forests in Viet Nam nationally. These figures provide an insight into the progress of implementation of relevant regulations to prevent the conversion and promote the conservation of natural forests, and of national-scale implementation of relevant REDD+ policies and measures.
Natural forest cover statistics
 Table showing natural forest cover (in three management categories) versus plantation and other land in percentages or ha, nationally and by forested province
Area and forest cover rate of Vietnam 2021
Year 2021 [1]
Area with forest (ha)
Natural forest (ha)
Plantation forest (ha)
Forest cover rate (%)
Total of the country
Total
14.745.201
10.171.757
4.573.444
42,02
Northwest
Total
1.808.285
1.584.974
223.310
47,06
Northeast
Total
3.970.714
2.331.602
1.639.112
56,34
Red river delta
Total
83.326
46.326
37.000
6,18
North Central
Total
3.131.061
2.201.435
929.625
57,35
The coastal
Total
2.451.496
1.566.677
884.820
50,43
Highlands
Total
2.572.701
2.104.097
468.604
45,94
South East
Total
479.871
257.304
222.566
19,42
Southwest
Total
247.748
79.341
168.407
5,44
[1]Attached to Decision No: 2860/QĐ-BNN-TCLN July 27, 2022 of the Ministry of Agriculture and Rural Development
Natural forest cover map in 2022 -
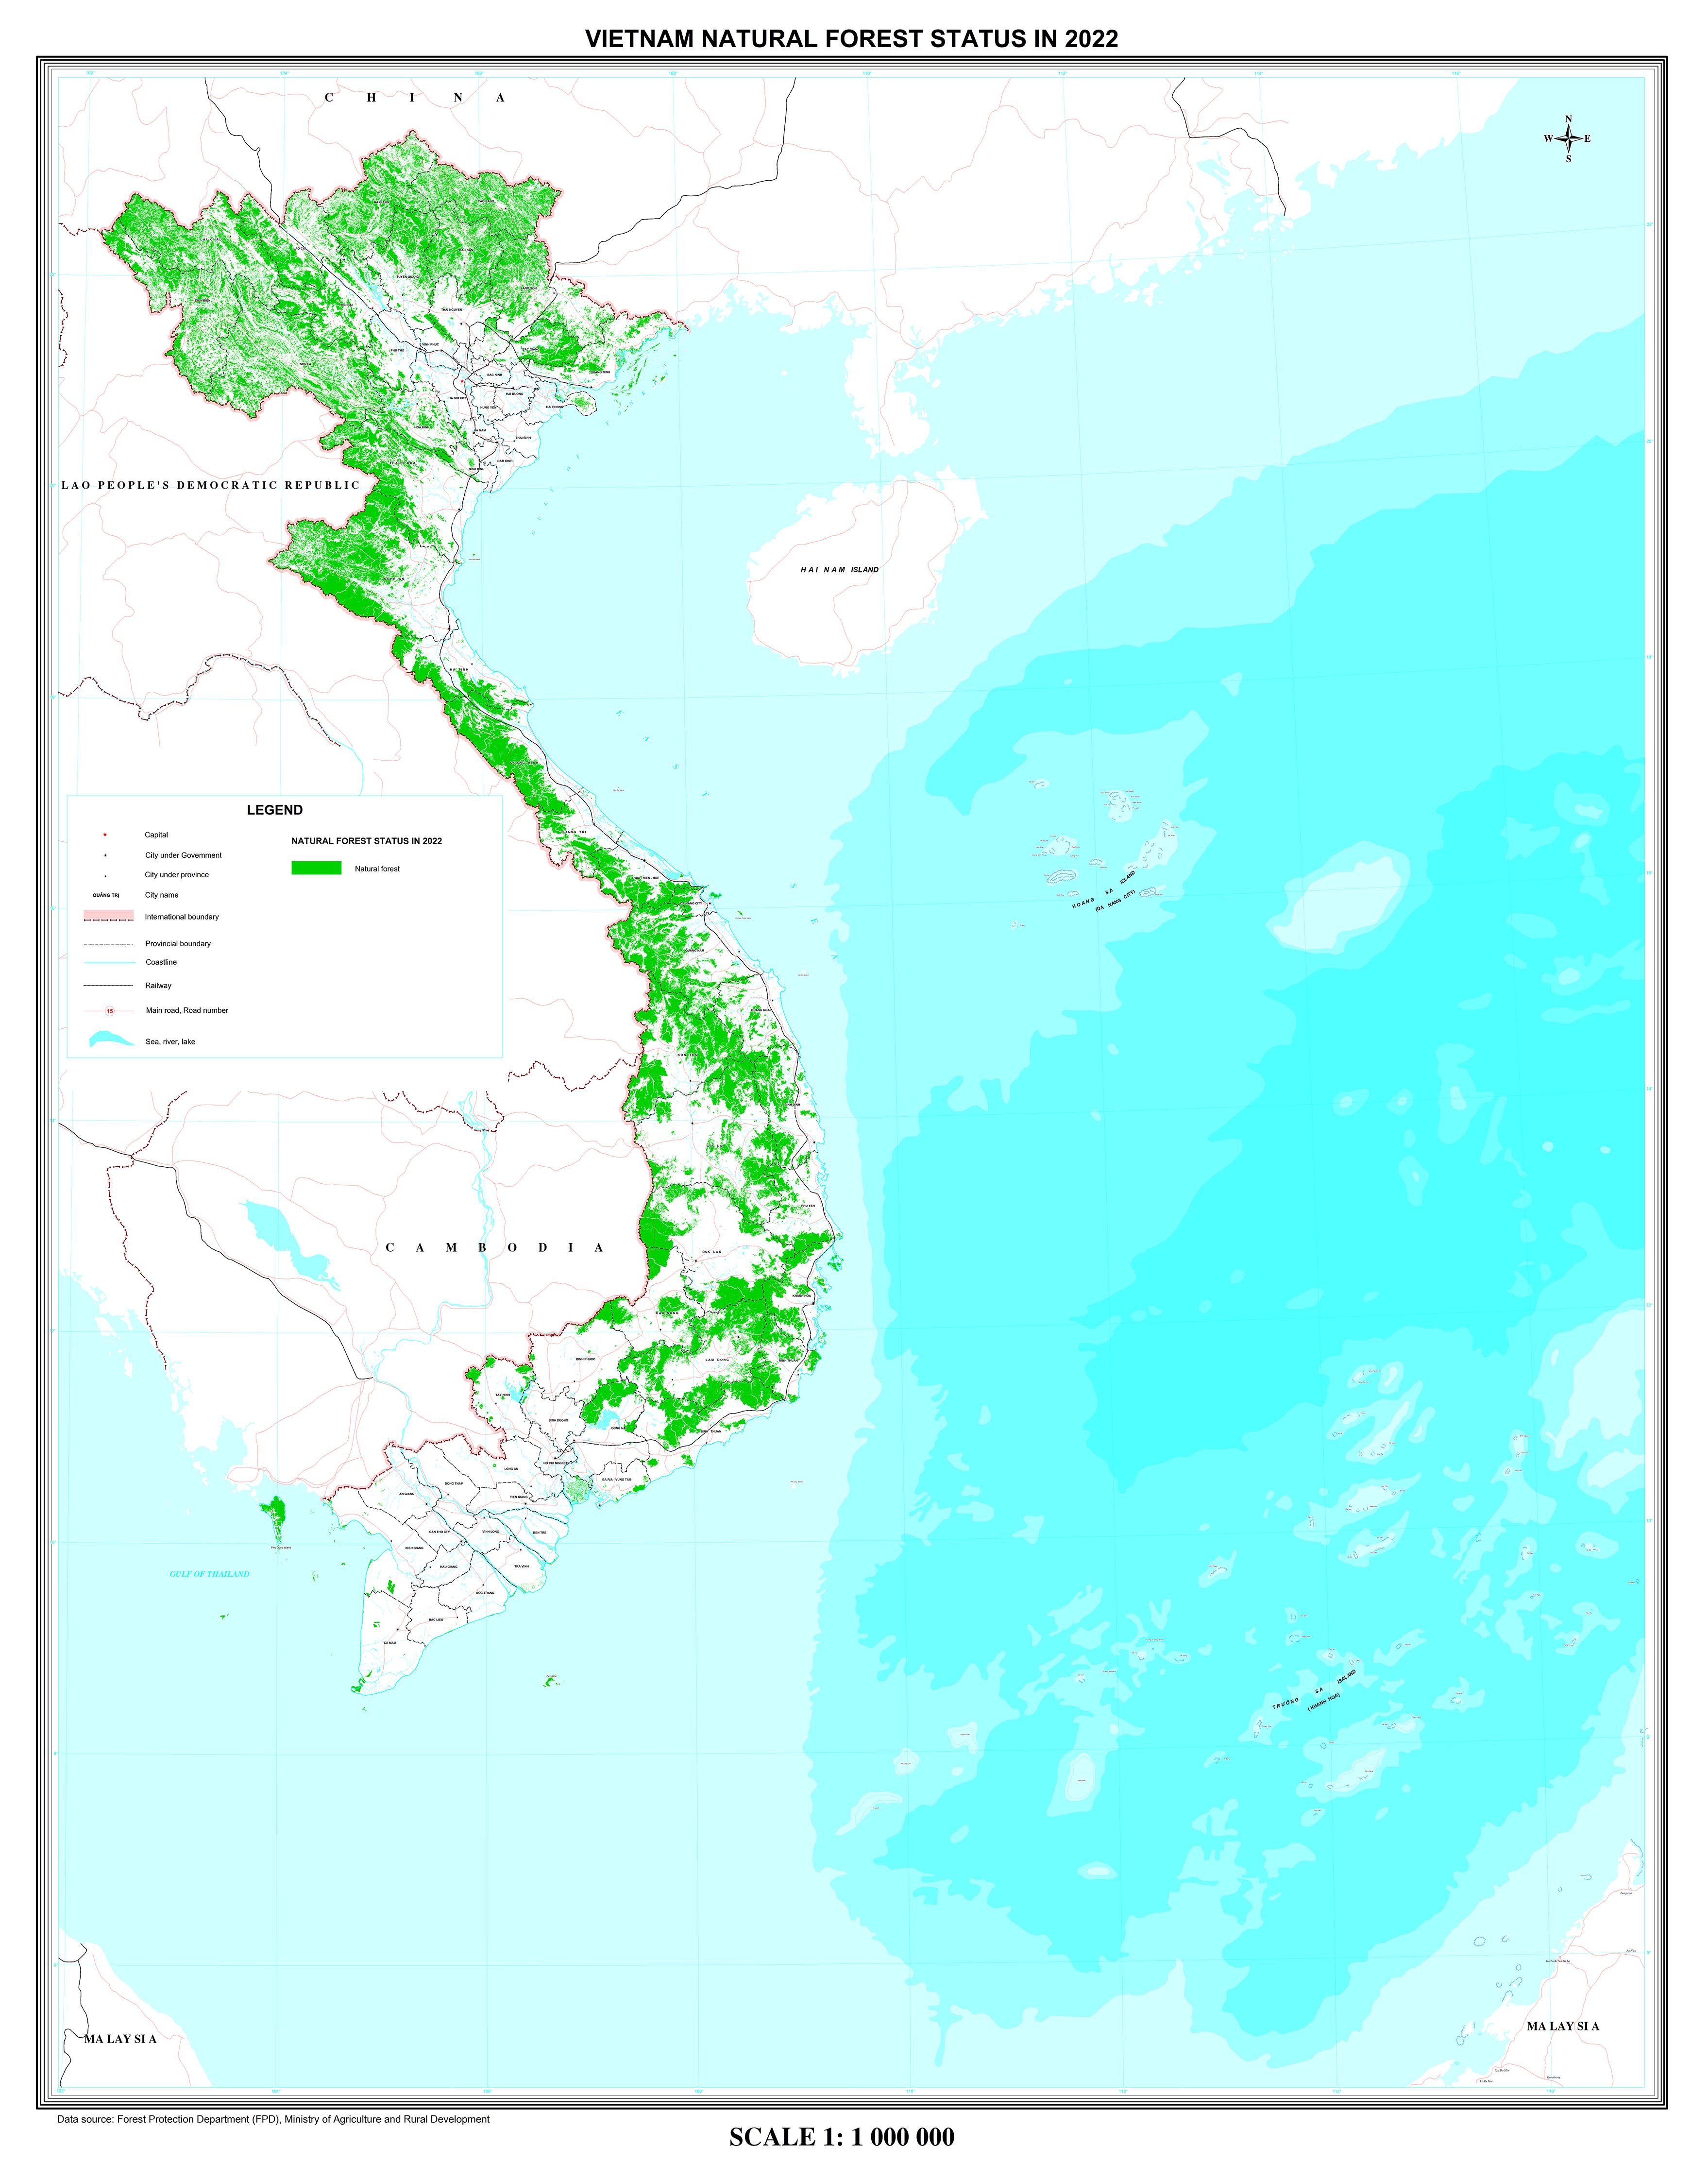
 Map of current status of natural forest vs plantation and other land
Conversion of natural forest nationally
Table showing change in natural forest nationally and that has been converted to other forest/land use classes[1]
-
- Trends in other land and ecosystem types
- Content not yet available.
- Progress on national biodiversity conservation targets
- Content not yet available
- Protected areas and forests in Viet Nam
- Map showing Viet Nam's protected areas
 Map showing Viet Nam's protected areas and forest cover[1]
[1] Forest Protection Department (FPD), Ministry of Agriculture and Rural Development
- Map showing Viet Nam's protected areas
- Trends in natural forest cover and other ecosystems
- Table showing natural forest area (ha) nationally in the three categories: total, protection, special use, for two or more periods
 Table showing natural forest area (ha) nationally in the three categories: total, protection, special use, for two or more periods[1]
- Table showing natural forest area (ha) nationally in the three categories: total, protection, special use, for two or more periods
- Trends in natural forest quality
- Table or graph showing the area (ha) of natural forest nationally for at least two periods, and by quality range, i.e. poor natural forest, medium natural forest, rich natural forest
Natural forest by quality range[1]
- Table or graph showing the area (ha) of natural forest nationally for at least two periods, and by quality range, i.e. poor natural forest, medium natural forest, rich natural forest
- Trends in forest function areas
- Table/figures showing forest area and quality nationally by forest function sub-class (ha). I.e. for each sub-class, show national extent in ha and proportion classified as poor, medium, rich
Forest area and quality nationally by forest function sub-class[1]
- Table/figures showing forest area and quality nationally by forest function sub-class (ha). I.e. for each sub-class, show national extent in ha and proportion classified as poor, medium, rich
 Map showing Viet Nam's protected areas and forest cover
- Forest sector strategy and program outcomes related to conservation
- Content not yet available.
- Contribution of emission reduction programs to conservation
- Content not yet available.
 Map showing Viet Nam's protected areas and forest cover
[1] Forest Protection Department (FPD), Ministry of Agriculture and Rural Development
Content not yet available
The following information shows outcomes related to
The incentive and benefit sharing mechanisms identified for REDD+ in Viet Nam. These include the results of the REDD+ benefits sharing mechanism as well as national trends in forest protection contracts and Payments for Forest Environmental Services (PFES). See links:
B2.3.3. Outcomes of REDD+ benefit-sharing
B2.2.6. Trends in land use certificates in conflict
Content not yet available
- Trends in forest owners
- Trends in land use certifications
Poverty rate by province and municipality, 2006-2016[1]
| Province / city | 2006 | 2010 | 2016 |
| WHOLE COUNTRY | 15.5 | 14.2 | 5.8 |
| Red River Delta | 10 | 8.3 | 2.4 |
| Ha Noi | 3 | 5.3 | 1.3 |
| Ha Tay | 12.4 | .. | .. |
| Vinh Phuc | 12.6 | 10.4 | 2.9 |
| Bac Ninh | 8.6 | 7 | 1.6 |
| Quang Ninh | 7.9 | 8 | 3.7 |
| Hai Duong | 12.7 | 10.8 | 2.3 |
| Hai Phong | 7.8 | 6.5 | 2.1 |
| Hung Yen | 11.5 | 11.1 | 2.6 |
| Thai Binh | 11 | 10.7 | 3.7 |
| Ha Nam | 12.8 | 12 | 4.4 |
| Nam Dinh | 12 | 10 | 3 |
| Ninh Binh | 14.3 | 12.2 | 4.3 |
| Northern midlands and mountain areas | 27.5 | 29.4 | 13.8 |
| Ha Giang | 41.5 | 50 | 20.8 |
| Cao Bang | 38 | 38.1 | 21.9 |
| Bac Kan | 39.2 | 32.1 | 15.8 |
| Tuyen Quang | 22.4 | 28.8 | 12 |
| Lao Cai | 35.6 | 40 | 18.1 |
| Yen Bai | 22.1 | 26.5 | 17.5 |
| Thai Nguyen | 18.6 | 19 | 7.1 |
| Lang Son | 21 | 27.5 | 14.5 |
| Bac Giang | 19.3 | 19.2 | 6.3 |
| Phu Tho | 18.8 | 19.2 | 6.3 |
| Dien Bien | 42.9 | 50.8 | 26.1 |
| Lai Chau | 58.2 | 50.2 | 27.9 |
| Son La | 39 | 37.9 | 20 |
| Hoa Binh | 32.5 | 30.8 | 13.4 |
| Northern Central area and Central coastal area | 22.2 | 20.4 | 8 |
| Thanh Hoa | 27.5 | 25.4 | 9.6 |
| Nghe An | 26 | 24.8 | 10.4 |
| Ha Tinh | 31.5 | 26.1 | 11 |
| Quang Binh | 26.5 | 25.2 | 10.6 |
| Quang Tri | 28.5 | 25.1 | 9.1 |
| Thua Thien-Hue | 16.4 | 12.8 | 3.7 |
| Da Nang | 4 | 5.1 | 0.5 |
| Quang Nam | 22.8 | 24 | 8.4 |
| Quang Ngai | 22.5 | 22.8 | 9.2 |
| Binh Dinh | 16 | 16 | 7.5 |
| Phu Yen | 18.5 | 19 | 6.4 |
| Khanh Hoa | 11 | 9.5 | 3.8 |
| Ninh Thuan | 22.3 | 19 | 6.5 |
| Binh Thuan | 11 | 10.1 | 2.3 |
| Central Highlands | 24 | 22.2 | 9.1 |
| Kon Tum | 31.2 | 31.9 | 14.2 |
| Gia Lai | 26.7 | 25.9 | 13.5 |
| Dak Lak | 24.3 | 21.9 | 7.3 |
| Dak Nong | 26.5 | 28.3 | 12.8 |
| Lam Dong | 18.3 | 13.1 | 4.5 |
| South East | 3.1 | 2.3 | 0.6 |
| Binh Phuoc | 10.5 | 9.4 | 5.1 |
| Tay Ninh | 7 | 6 | 1.5 |
| Binh Duong | 0.5 | 0.5 | 0 |
| Dong Nai | 5 | 3.7 | 0.5 |
| Ba Ria - Vung Tau | 7 | 6.8 | 0.8 |
| Ho Chi Minh city | 0.5 | 0.3 | .. |
| Mekong River Delta | 13 | 12.6 | 5.2 |
| Long An | 8.7 | 7.5 | 4.2 |
| Tien Giang | 13.2 | 10.6 | 5.3 |
| Ben Tre | 16.2 | 15.4 | 7.1 |
| Tra Vinh | 21.8 | 23.2 | 10 |
| Vinh Long | 11 | 9.5 | 4.3 |
| Dong Thap | 12.1 | 14.4 | 5.8 |
| An Giang | 9.7 | 9.2 | 2.7 |
| Kien Giang | 10.8 | 9.3 | 2.7 |
| Can Tho | 7.5 | 7.2 | 1.7 |
| Hau Giang | 15 | 17.3 | 7.7 |
| Soc Trang | 19.5 | 22.1 | 8.7 |
| Bac Lieu | 15.7 | 13.3 | 6.9 |
| Ca Mau | 14 | 12.3 | 4 |
[1] Viet Nam General Statistics Office, https://www.gso.gov.vn/default_en.aspx?tabid=783
 Map showing production forests nationally

[1] Forest Protection Department (FPD), Ministry of Agriculture and Rural Development
National production of wood (1000 m3) by kinds of economic activity [1]
|
| 2005 | 2010 | 2015 |
| TOTAL | 2,996.4 | 4,042.6 | 9,199.2 |
| State | 915.4 | 1,376.8 | 2,733.8 |
| Non-State: | 2,041.5 | 2,612.5 | 6,344.4 |
| Collective | 2.2 | 3.0 | 6.7 |
| Private | 1,999.1 | 2,555.2 | 6,208.4 |
| Household | 40.2 | 54.3 | 129.3 |
| Foreign invested sector | 39.5 | 53.3 | 121.0 |
| Index (Previous year = 100) - % | |||
| TOTAL | 114.0 | 107.3 | 119.4 |
| State | 109.1 | 109.5 | 116.0 |
| Non-State: | 114.1 | 106.2 | 120.9 |
| Collective | 122.2 | 120.0 | 117.3 |
| Private | 116.3 | 106.2 | 121.0 |
| Household | 117.2 | 107.3 | 120.0 |
| Foreign invested sector | 116.5 | 107.2 | 121.1 |
Gross output of wood (1000 m3) by province by cities, provinces and year[1]
| Administrative unit | 2005 | 2010 | 2015 |
| Nationally | 2996.4 | 4042.6 | 9199.2 |
| Red River Delta | 157 | 187.3 | 490.6 |
| Ha Noi | 2.3 | 10 | 9.7 |
| Ha Tay | 6.3 | .. | .. |
| Vinh Phuc | 27.1 | 27.8 | 26.6 |
| Bac Ninh | 4.9 | 4 | 4.8 |
| Quang Ninh | 54.2 | 104.6 | 395 |
| Hai Duong | 1.9 | 2.5 | 1.4 |
| Hai Phong | 10.5 | 6.7 | 3 |
| Hung Yen | 9.1 | 5 | 3.1 |
| Thai Binh | 4.6 | 3.9 | 3 |
| Ha Nam | 12.5 | 3.9 | 2 |
| Nam Dinh | 7 | 7.5 | 7.3 |
| Ninh Binh | 16.6 | 11.4 | 34.7 |
| Northern midlands and mountain areas | 996.7 | 1328.1 | 2866 |
| Ha Giang | 52.3 | 73 | 100.7 |
| Cao Bang | 23.5 | 31.5 | 19.8 |
| Bac Kan | 27.5 | 53.8 | 148.4 |
| Tuyen Quang | 152 | 225.7 | 661 |
| Lao Cai | 32.4 | 53.9 | 53 |
| Yen Bai | 148.6 | 200.1 | 450 |
| Thai Nguyen | 27.1 | 50.7 | 171.1 |
| Lang Son | 64.1 | 75.3 | 80 |
| Bac Giang | 39.1 | 62.7 | 400.1 |
| Phu Tho | 150.4 | 273.5 | 437.9 |
| Dien Bien | 65.7 | 35.1 | 18.6 |
| Lai Chau | 5.5 | 9.4 | 8 |
| Son La | 53.4 | 43.9 | 42.1 |
| Hoa Binh | 155.1 | 139.5 | 275.3 |
| Northern Central/Central coastal area | 833.2 | 1237.7 | 4388 |
| Thanh Hoa | 33.7 | 51.3 | 398.5 |
| Nghe An | 93.5 | 125.7 | 351.2 |
| Ha Tinh | 47.5 | 84.4 | 263.4 |
| Quang Binh | 37.3 | 74 | 226.4 |
| Quang Tri | 44.6 | 105.7 | 401 |
| Thua Thien-Hue | 54.2 | 82.5 | 511.9 |
| Da Nang | 23.5 | 24.2 | 21.4 |
| Quang Nam | 128.7 | 189 | 702 |
| Quang Ngai | 151.4 | 185.5 | 715.4 |
| Binh Dinh | 127.3 | 196 | 680.2 |
| Phu Yen | 11.7 | 30.5 | 44.5 |
| Khanh Hoa | 39.8 | 35.1 | 28.5 |
| Ninh Thuan | 3.3 | 7 | 1.4 |
| Binh Thuan | 36.7 | 46.8 | 42.2 |
| Central Highlands | 309.3 | 416.5 | 456.6 |
| Kon Tum | 38.4 | 16.7 | 22.4 |
| Gia Lai | 118 | 220.7 | 120.9 |
| Dak Lak | 79.9 | 49.6 | 182.6 |
| Dak Nong | 25.4 | 33.8 | 8.8 |
| Lam Dong | 47.6 | 95.7 | 121.9 |
| South East | 90.4 | 262.8 | 323.8 |
| Binh Phuoc | 7.1 | 20.6 | 12.5 |
| Tay Ninh | 52 | 68.5 | 66.8 |
| Binh Duong | 1.3 | 1.2 | 10.1 |
| Dong Nai | 13.8 | 74.8 | 139.1 |
| Ba Ria - Vung Tau | 2.2 | 84 | 81.5 |
| Ho Chi Minh city | 14 | 13.7 | 13.8 |
| Mekong River Delta | 609.8 | 610.1 | 674.2 |
| Long An | 84.7 | 86.2 | 78.7 |
| Tien Giang | 74 | 80 | 58 |
| Ben Tre | 7.1 | 2.7 | 2.7 |
| Tra Vinh | 60.4 | 77.2 | 78.4 |
| Vinh Long | 18.6 | 18.1 | 17.6 |
| Dong Thap | 98.7 | 112.1 | 96.9 |
| An Giang | 58.4 | 51 | 74 |
| Kien Giang | 57.6 | 42.9 | 38.1 |
| Can Tho | 7.6 | 4.7 | 4.2 |
| Hau Giang | 9.1 | 10.1 | 10.8 |
| Soc Trang | 38.8 | 38.7 | 33 |
| Bac Lieu | 2.9 | 2.9 | 2.4 |
| Ca Mau | 91.9 | 83.5 | 179.4 |
[1] General Statistics Office of Viet Nam. 2018. Gender Statistics in Viet Nam 2016. https://www.gso.gov.vn/default_en.aspx?tabid=778
Content not yet available
Content not yet available’